QGISのシンボル用SVGはStroke,Fillの色や透明度を変更できるように独自の記述になっている。
  <path
     d="M 293.39062 35.525391 A 256 256 0 0 0 37.390625 291.52539 A 256 256 0 0 0 293.39062 "
     fill="param(fill)"
     fill-opacity="param(fill-opacity)"
     stroke="param(outline)"
     stroke-opacity="param(outline-opacity)"
     stroke-width="param(outline-width)"
     id="path6220" />
</svg>
このSVGファイルをQSvgRendererを使って描画しても正しく描画できないためFillやStrokeを編集してから描画する。
self.model = QStandardItemModel(self)
fp = open('c:\\3Dkaoku\\svg\\circle.svg', 'r')
datas = fp.read()
fp.close()
datas = datas.replace('param(fill)', '#000000')
datas = datas.replace('param(fill-opacity)', '1')
datas = datas.replace('param(outline)', 'none')
datas = datas.replace('param(outline-opacity)', '0')
datas = datas.replace('param(outline-width)', '0')
bytearray = datas.encode(encoding='utf-8')
bArray = QByteArray(bytearray)
img = QImage(24, 24, QImage.Format_ARGB32)
img.fill(Qt.white)
painter = QPainter(img)
renderer = QtSvg.QSvgRenderer(bArray)
renderer.render(painter)
pix = QPixmap.fromImage(img)
icon = QIcon(pix)
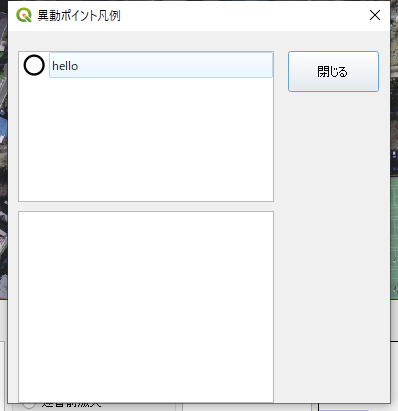
item = QStandardItem(icon, 'hello')
self.model.appendRow(item)
self.listView.setIconSize(QSize(200,200))
self.listView.setUniformItemSizes(True)
self.listView.setModel(self.model)